Archive for the ‘Population’ Category

Detroit’s police force above 3 officers per 1,000 residents

January 27, 2014

In the following post, we will examine the number of sworn officers-which includes police officers, sheriff’s deputies and public safety officers-per 1,000 residents in the seven county region of Southeastern Michigan. As can be seen in the below maps, there are several municipalities that do not have their own police force. These are either patrolled by the county sheriff’s department or have a public safety department, which is comprised of both police and fire personnel.

The maps and graph below both show that the City of Detroit had one of the highest number of sworn officer per 1,000 residents of municipalities in the region. According to a local law enforcement chief, who serves on the Southeast Michigan Association of Police Chiefs, it is unofficially recommended there should be a minimum of one sworn police officer per 1,000 residents in municipalities.

Slide3

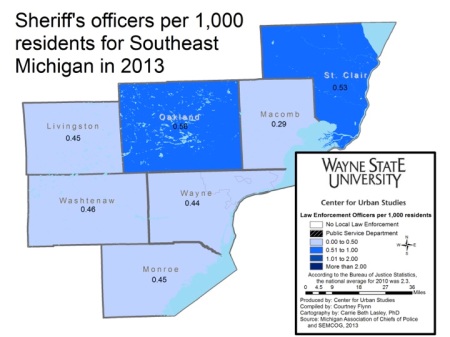
The above map shows there is less than one sheriff’s deputy per 1,000 residents in every county in Southeastern Michigan. These figures were determined by taking the total number of sheriff’s deputies in each county department and dividing it by the total population of each county; these results were then multiplied by 1,000.

Oakland and St. Clair counties had the highest rates at .56 and .53 per 1,000 residents, respectively.

While no county in the region holds up to the one sworn officer per 1,000 residents standards, it should be noted that many municipalities within each county either have their own police department or pay the sheriff’s department for coverage. The county sheriff’s departments are required to cover areas with no police coverage.

Slide5

Slide6

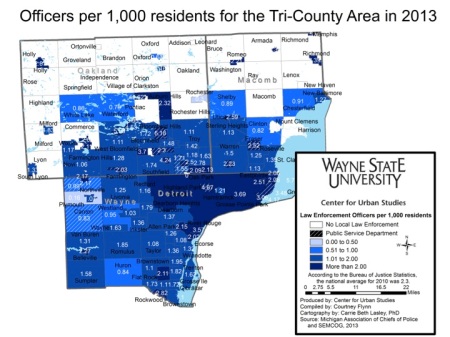
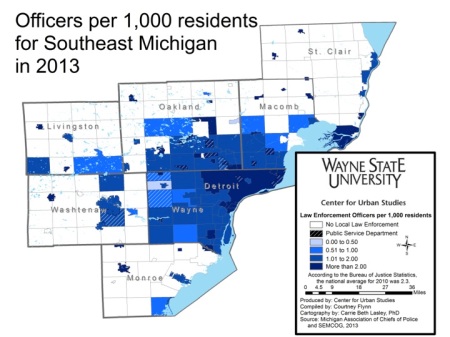
The above two maps show the number of local law enforcement officers per 1,000 residents in 2013. The City of Detroit was one of 104 municipalities (out of 123) in the seven-county region to have more than one officer per 1,000 residents. In 2013 there were about 3.7 officers per 1,000 Detroit residents.

The Lake Angelus Police Department had the highest rate at about 43 officers per 1,000 residents. However, this small lakeside community only had 298 full-time residents with 13 total sworn officers. Aside from this anomaly, Lake Orion had the highest rate in 2013 with a rate of 5 sworn officers per 1,000 residents.

Within the seven county region, areas such as South Rockwood (6.3) and Yale (5.7) had well above the suggested number of officers per 1,000 residents, assuming the 1 per 1,000 is an appropriate benchmark.

Slide8


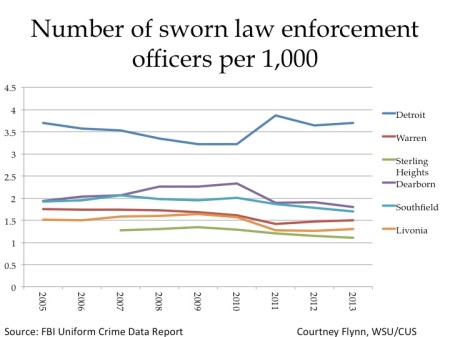
Of six of the largest communities in the in Tri-County region, Detroit has consistently had the highest number of sworn officers per 1,000 residents since 2005, according to FBI data. The rate of officers in this time ranged from 3.2 to about 3.9.

In January of 2013 Interim Police Chief Chester Logan stated he was skeptical about releasing, then current, officer numbers, according to an MLive article. In the same article, Logan also said the city had 40 percent fewer officers at the beginning of 2013 than 10 years prior. While this statistic has since been widely used throughout the media, it also caused some to dig deeper into the operations of the department.

In an August 2013 article produced by the Mackinac Center for Public Policy, confusion over the deployment of Detroit’s patrol officers were brought to light. For example, city officials were quoted in August of 2013 as saying 33 percent of the entire department in 2012 were involved in policing and the rest performed administrative functions. Police officials were quoted, however, as saying that 68 percent of the department was involved in policing in 2012.A report conducted by the Emergency Manager’s Office in the summer of 2013 concluded the discrepancy could not be resolved, according to the article.

While the discrepancy over the use of police has not been resolved, it should be noted the Detroit Police Department has benefited from several grants in recent years. For example, in September 2013 the federal government announced it was providing the City of Detroit with $1.8 million to help pay for 10 police officers. Other grants awarded to the city helped with purchasing new technology for the police department and violence prevention programs.

In 2011, all the above police departments experienced a decrease in the rate of officers per 1,000 residents, with the exception of Detroit. In 2010 the City of Detroit had 3.2 officers per 1,000 residents and in 2011 it had 3.8. Detroit’s rate increase though was not reflective of an increase in the number of officers, but a decline in the population. This is true for all police departments, except for Warren, from 2010 to 2013 in the above chart.

Since 2011, Warren and Livonia have experienced a rate increase. The two cities have been able to sustain their police forces, and increase their officer to population ratio, through increased taxes and department reorganizations. In August of 2012 Warren voters approved a police and fire service millage. Also in 2012 the City of Livonia continued to reorganize its police department, which brought in additional non-officers to perform administrative duties so more patrol officers could be on the street.

Sterling Heights (data wasn’t available for 2005 and 2006) had the lowest rates, ranging from about 1.1 to 1.3. Although Sterling Heights began to lose officers when the recession began in 2008, because property values were declining, residents approved a millage in 2013 to support the police and fire departments. This millage approval allowed the Sterling Heights Police Department to keep 45 officers on staff that were initially slated to be laid off.
 

Economic and Demographic indicators: Detroit’s population up as are home prices

January 6, 2014

FOLLOW US AT WWW.DRAWINGDETROIT.COM

In recent weeks information regarding the increase in Michigan’s population and an estimated decrease of migration out of the state have been published in various news outlets. According to information from the Southeastern Michigan Council of Governments, Detroit’s population has also experienced an increase.

In addition:

•The unemployment rate in Detroit and across the state has been decreasing; (monthly)
•The Purchasing Manager’s Index for Southeast Michigan decreased from November 2013 to December 2013; (monthly)
•The Commodity Price Index experienced a decrease from November 2013 to December 2013 for Southeast Michigan; (monthly)
•Standard and Poor’s Case-Shiller Index show that the prices of homes in the Detroit area have been experiencing an increase; (monthly)
•The number of building permits obtained in Wayne and Oakland Counties decreased from October 2013 to November 2013; (monthly).
Slide02

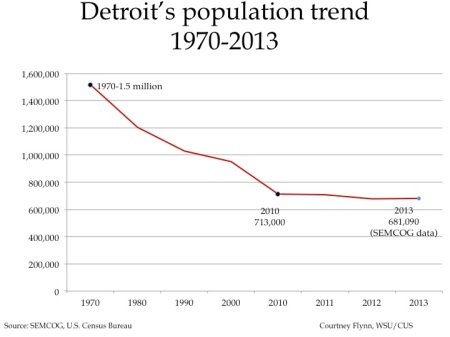
Overall, the City of Detroit’s population has experienced a decline, going from about 1.5 million residents in 1970 to 677,891 in 2012. However, from 2012 to July 1, 2013 the city has experienced a population increase, according to the Southeastern Michigan Council of Government. SEMCOG estimated in 2012 the city had 677,891 residents, and as of July 1, 2013 the SEMCOG estimate was 681,090 residents. The biannual population estimates from SEMCOG are based on trends from area demographics.

Slide04

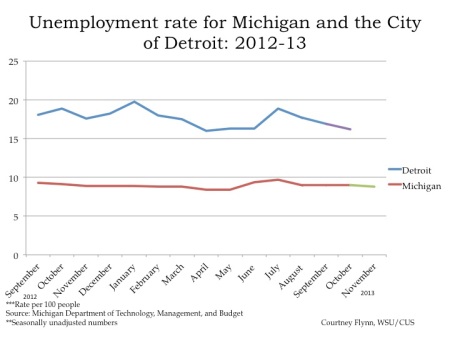
According to the most recent data provided by the Michigan Department of Technology, Management and Budget, from October to November of this year the unemployment rate for the State of Michigan has decreased from 9 to 8.8 percent. They estimate the City of Detroit also experienced an unemployment rate decrease. In September the rate was recorded at 16.9 percent and in October it was estimated at 16.2 percent.

Employment numbers for Detroit, and other localities in the State of Michigan, were not available for November because of the government shutdown in October.

Slide06

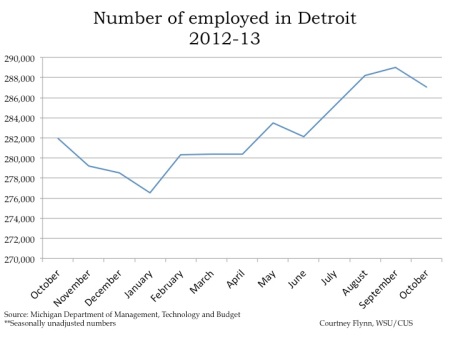
The number of employed in the City of Detroit decreased by 1,928 people from September to October of 2013. In October there were 287,067 people employed.

Slide08

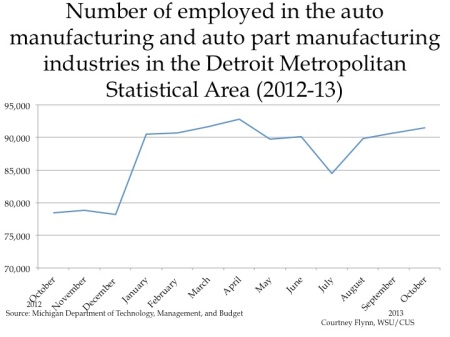
The above chart shows the number of people employed in auto manufacturing industry in the Detroit Metropolitan Statistical Area throughout 2012 and into 2013. Employment increased in the auto manufacturing and auto parts manufacturing industries from September to October. In September it was reported there were 90,700 people employed in these industries, and in October there were 91,500 employed; this is an increase of 800 employees.

Slide10

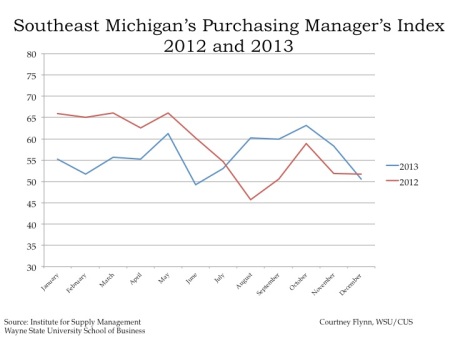
The Purchasing Manger’s Index (PMI) is a composite index derived from five indicators of economic activity: new orders, production, employment, supplier deliveries, and inventories. A PMI above 50 means the economy is expanding.

According to the most recent data released on Southeast Michigan’s Purchasing Manager’s Index, there was a decrease of 7.7 points from November 2013 to December 2013. In December 2013, a PMI of 50.6 was recorded, which is reflective a declining in economic expansion because of a reduction in new orders and production.

Slide12

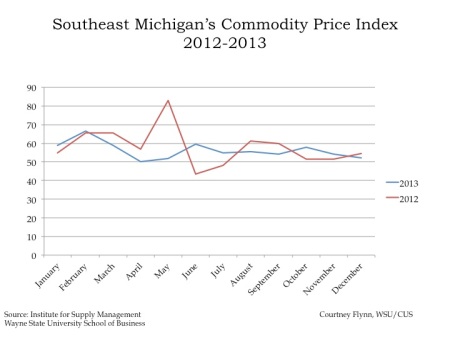
The Commodity Price Index, which is a weighted average of selected commodity prices, was recorded at 52.2 in December 2013, which was 2.2 lower than the previous month.

Slide14 Slide15

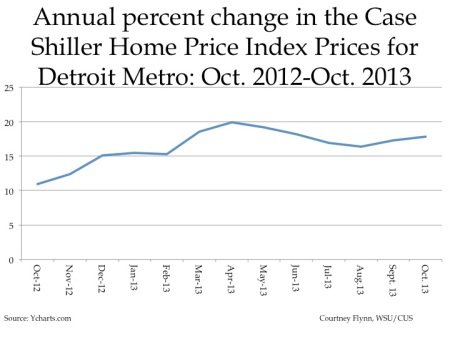
The above charts show the Standard and Poor’s Case Shiller Home Price Index for the Detroit Metropolitan Statistical Area. The index includes the price for homes that have sold but does not include the price of new home construction, condos, or homes that have been remodeled.

According to the index, the average price of single-family dwellings sold in Metro Detroit was $92,140 in October 2013. This was an increase of approximately $13,420 from the average price in October 2012.

The annual percent change in the Home Price Index showed a slight decrease from the increase the region experienced in July. Between August 2012 and August 2013, there was a 16.34 percent increase in home prices for the Detroit MSA.

Slide17 Slide18 Slide19

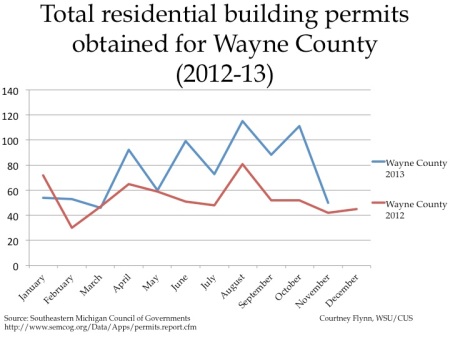
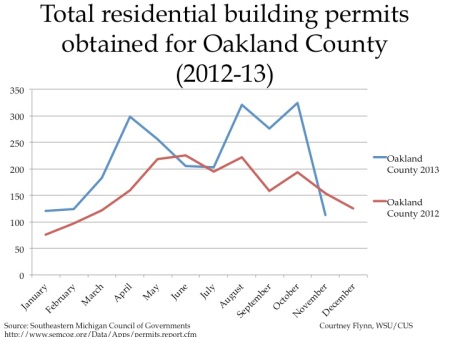
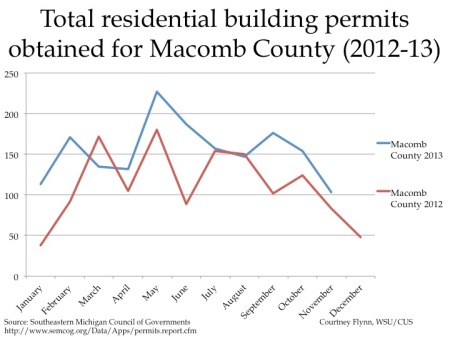
The above charts show the number of residential building permits obtained each month in Wayne, Oakland, and Macomb counties from January 2012 until November 2013. These numbers are reported by local municipalities to the Southeastern Michigan Council of Governments and include single family, two family, attached condo, and multi-family units.

All three counties experienced a decrease in the number of building permits pulled from October to November, consistent with a seasonal decline in home construction. Oakland County experienced the most dramatic decrease in the number of building permits pulled. In October 324 permits were pulled and in November there were 113; this is a decrease of 211. Wayne County experienced a decrease of 61 permits pulled and Macomb County experienced a decrease of 51.

In addition to Oakland County experiencing the most dramatic decrease, it was the only county that had fewer permits pulled in November 2013 than November 2012.

Most Detroit residents employed in health care, educational services, and social assistance industries

December 30, 2013

FOLLOW US AT WWW.DRAWINGDETROIT.COM

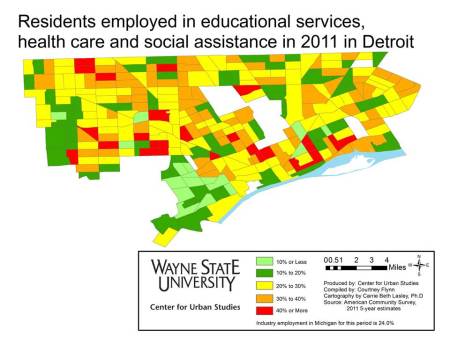
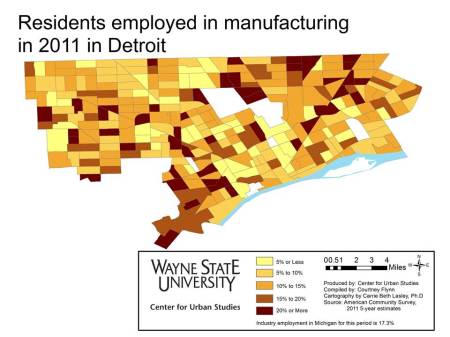
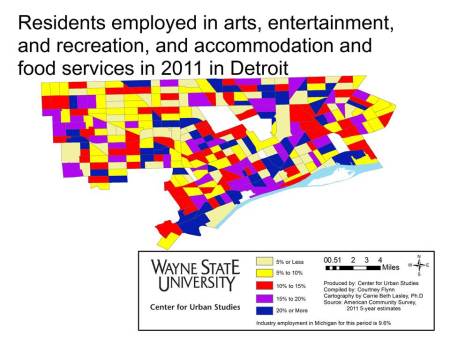
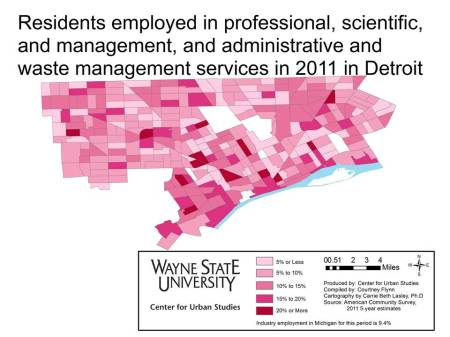
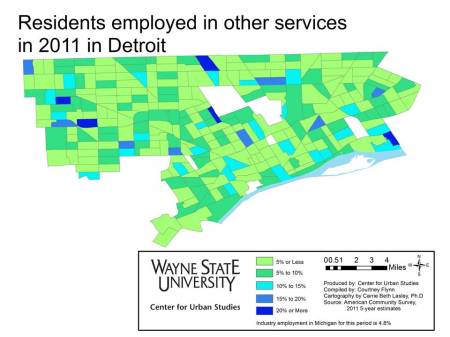
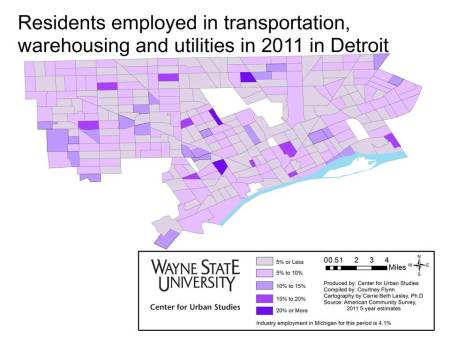
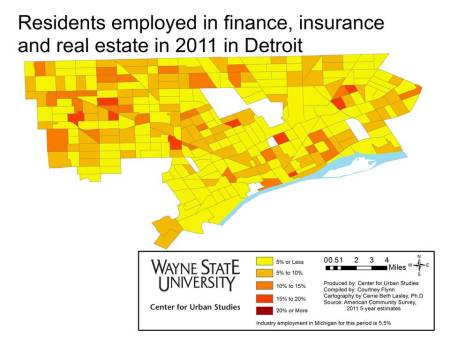
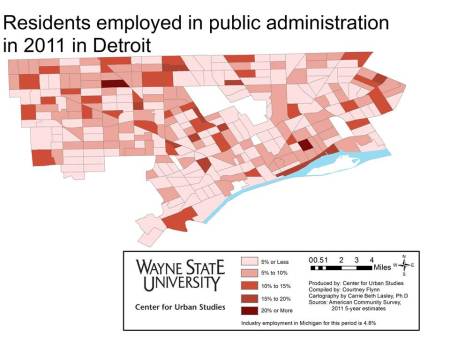
This post is an extension of last week’s (link here), in that we are showing which industries draw the most about of Detroit residents, ages 16 and older, for employment. Here  we examine the types of jobs by percentage of the working population in the City of Detroit in 2011, according to the five-year American Community Survey. To learn more about the specific occupations included in the different industries described  in this post please click here.

In reviewing the maps, a pattern similar to the region is reflected. The structure of the local economy is based around health care, educational services, social assistance, manufacturing, arts, entertainment, and food service industries.

Slide3 Slide4 Slide5 Slide6 Slide7 Slide8 Slide9 Slide10 Slide11 Slide12 Slide13 Slide14

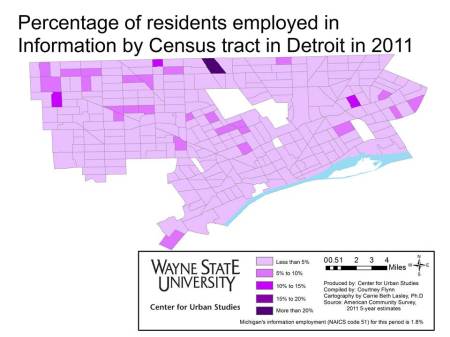
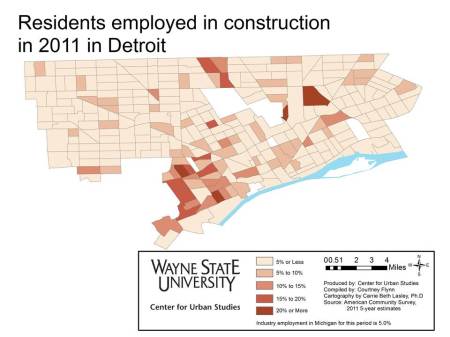
According to the map, in the health care, educational services, and social assistance industries there were about 20 Census tracts that had 41 percent or more of the population employed in these services. There were also about 75 Census tracts where between 30 and 40 percent of the population was employed in these industries in 2011.The other top industries in which Detroit residents were employed in for the year 2011 were the arts, entertainment and recreation, accommodation, and food service industries. There were about 40 Census tracts in the city were 20 percent or more of the residents were employed in these industries. Manufacturing also had a large employment draw in the city; there were about 35 Census tracts within Detroit where 20 percent or more of the 16 years and older population was employed in the manufacturing industry.

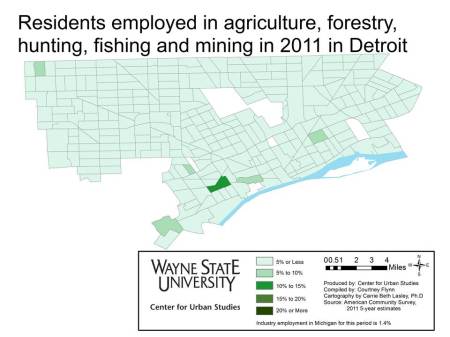
Agriculture was the industry with the least amount of Detroit residents employed in it. All but five of the Census tracts had 5 percent or less of the population employed in the industry. The information and construction industries also had low draws. There was a pocket in southwest Detroit though where there was about 15 Census tracts in 2011 with 15 percent or more of the population employed in construction.

Health services, manufacturing dominate area

December 23, 2013

FOLLOW US AT WWW.DRAWINGDETROIT.COM

Manufacturing, health, social services and education  were the predominant industry occupations in Southeastern Michigan and the tri-county area in 2011, according to the five-year American Community Survey. The agriculture, forestry, hunting and fishing industries had the smallest proportion of people employed in the area for same time period.

In this post, we examine the types of jobs by percentage of the working population in Southeastern Michigan and the tri-county area and the City of Detroit as a whole. To learn more about the specific occupations included in the different industries described  in this post please click here.

Slide03
Slide04

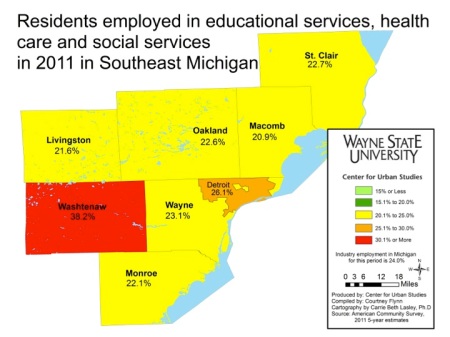
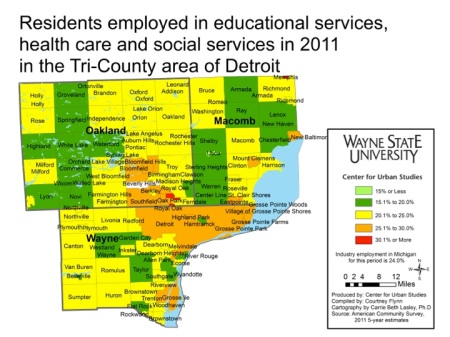
Washtenaw County had the largest percentage of residents employed in educational services, health care and/or social services. Of the employable population over the age 16, 38.2 percent were employed in such fields. This may be due to the fact that Ann Arbor, in Washtenaw County, is home to the University of Michigan and University of Michigan Hospital, St. Joseph Mercy Hospital and a VA Health Care Center. Detroit, which will be further explored in our next post, had 26.1 percent of its residents employed in these industries. Wayne State University is located in Detroit, as is the Detroit Medical Center, Henry Ford Hospital, and a VA Health Care Center.

Macomb County had the fewest number of residents employed in these industries, at 20.9 percent, however, the cities of New Baltimore, Eastpointe, and Mount Clemens had between 25.1 and 30 percent of its residents employed in these industries..

Slide06 Slide07 Slide09

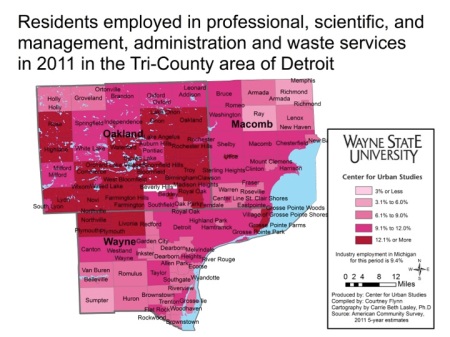
In the tri-county area, Oakland County, along with northwestern Wayne County, had several municipalities where more than 12 percent of the population was employed in professional, scientific, management, administration and waste services industries. Much of Macomb County had between 9.1 and 12 percent of the residents employed in one of those fields.

Slide11

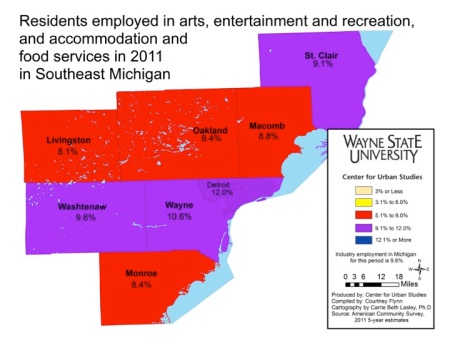
For the arts, entertainment and recreation, and accommodation and food services industries, the highest percent of the population employed across Southeastern Michigan is in the City of Detroit at 12 percent in 2011. Wayne County is the county in the region with the highest percent of its population employed in such occupations, and Livingston County has the fewest at 8.1 percent.

Slide13 Slide14

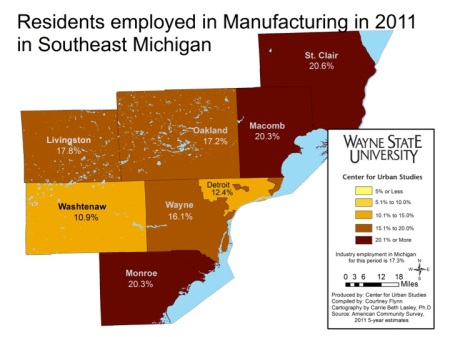
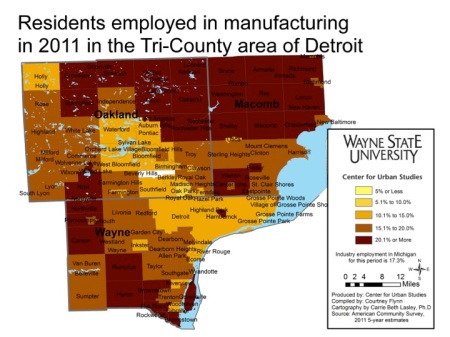
Of the seven counties in Southeastern Michigan, Wayne had the fewest percent of residents employed in the manufacturing industry, at 16.1 percent. St. Clair County had the most at 20.6 percent and Macomb and Monroe counties came in at a close second with 20.3 percent.

There was no municipality in the tri-county area where fewer than 5 percent of the residents were employed in manufacturing.

Slide16

Slide17

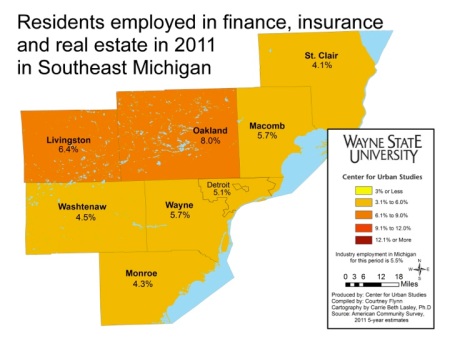
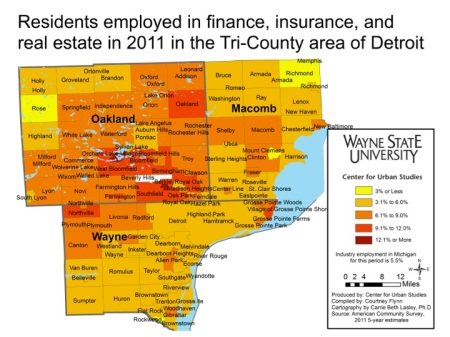
Finance, insurance, real estate, (FIRE) was a more common industry for residents from Oakland County at 8 percent; Livingston County came in second at 6.1 percent. There were two municipalities in Oakland County where 12.1 or more of the population was employed in one of those fields – Orchard Lake and Lathrup Village.

Slide19 Slide20

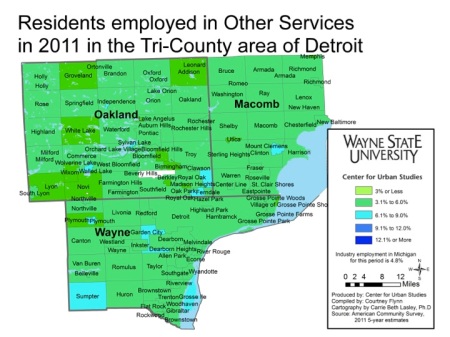
The percent of residents across the seven-county region employed in other services, which includes such jobs as mechanics, repairmen, launders and veterinary services fields, is distributed fairly evenly, ranging from 4.1 to 4.9 percent. Sumpter Township, Garden City, Grosse Ile, Dearborn Heights, Ferndale, Clawson, and Mount Clemens were all municipalities where between 6.1 and 9 percent of the populations were employed in the other services.

Slide22

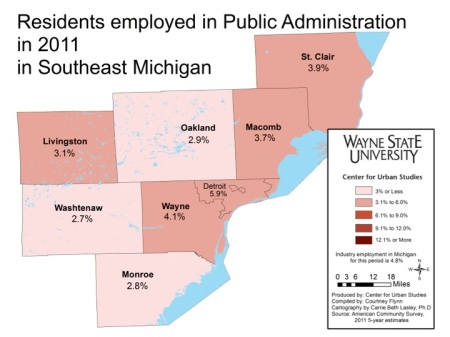
The City of Detroit had the highest population employed in Public Administration at 5.9 percent. Of all the counties in Southeastern Michigan, Wayne County had the highest number of employed at 4.1 percent.

Slide24

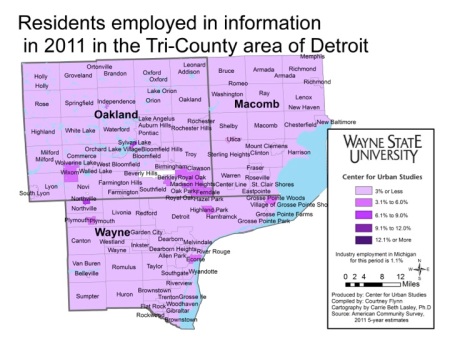
Although information services is described to be a growing field, less than 3 percent of the populations that makeup Macomb, Oakland, and Wayne counties are employed in this industry. The exceptions are residents in Royal Oak (3.1), Wixom (3.1),the cities of Highland Park (3.2), Hazel Park (3.2), Clarkston (3.3), Keego Harbor (3.5), Ferndale (3.7), Plymouth (3.8), Ecorse (4.0), Grosse Pointe Woods (4.3), Huntington Woods (4.3), Pleasant Ridge (4.6) Lathrup Village (5.7), Northville at (6.4) percent and Sylvan Lake at (6.9) that are employed in the field.

Slide26 Slide27

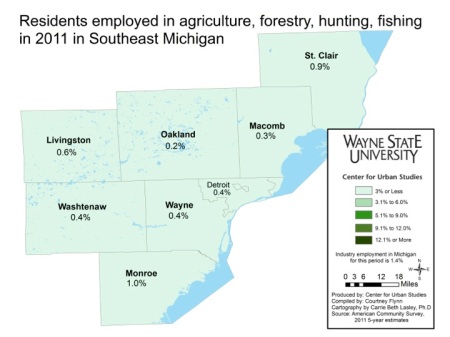
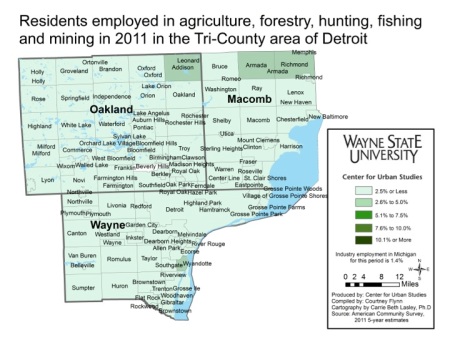
None of the seven counties in the region boast a population in which more than 1 percent is employed in the agriculture, hunting, fishing, or forestry fields. Monroe County has the highest population at 1 percent. The cities of Leonard and Addison in Oakland County; Armada, Richmond, and Memphis in Macomb County; and Wyandotte in Wayne County had between 2.6 and 5 percent of its population employed in one of the above-mentioned fields.

Mortality related to Disease:Region below average for Alzheimer’s mortality

November 25, 2013

PLEASE CONTINUE TO FOLLOW US AT WWW.DRAWINGDETROIT.COM

This post portrays regional mortality rates related to disease, in particular, cancer, heart disease and Alzheimer’s disease.

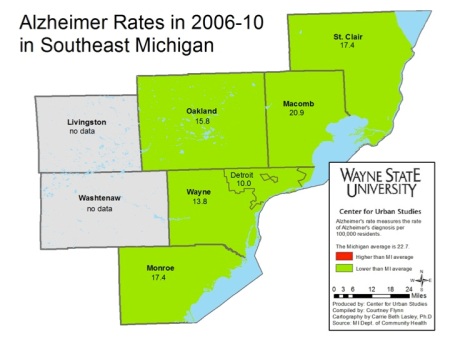
The cancer mortality rate for those above the age 75 was the highest of the three diseases presented below. Alzheimer’s disease was the only illness presented below where none of the counties in Southeastern Michigan has a mortality rate above the state average. From 2006-2010, the rolling average mortality rate related to Alzheimer’s disease for the State of Michigan was  recorded at 22.7 deaths per 100,000 residents. Macomb was highest in the region at 20.9.

Slide03 Slide04 Slide05


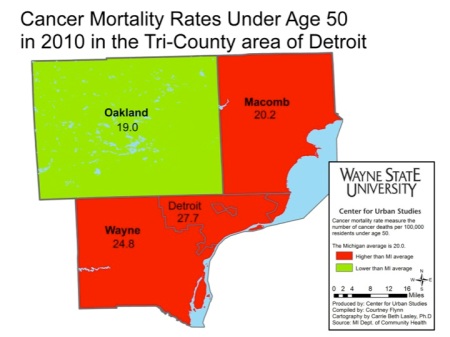
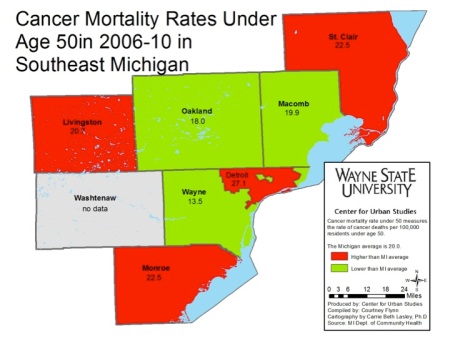
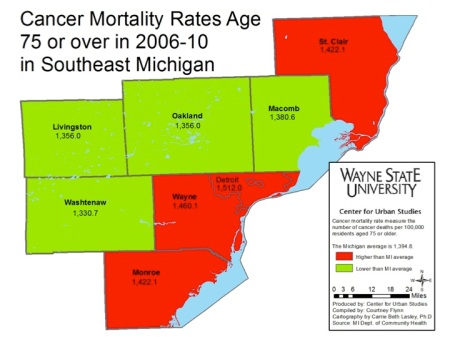
The mortality rate for those 75 or older with cancer is about 150 times higher than those below the age of 50. For example, in the City of Detroit the mortality rate for those above the age of 75 with cancer was 1,512 per 100,000 residents from 2006 to 2010. For those below the age of 50 the mortality rate was 27.1 per 100,000 residents for the City of Detroit during the same time frame.

On all three maps, Oakland County was below the state average for the mortality rate related to cancer. Mortality rates related to cancer for the City of Detroit, however, were consistently above the state average, across age group and time.

The Michigan Department of Community Health did not document cancer mortality rates for those between the age of 51 and 74.

Slide07


Heart disease is another illness where Detroit was again above the state average, but in this case lower than Wayne County as a whole. In 2010, according to the Michigan Department of Community Health (MDCH), there were 236 deaths related to heart disease in the State of Michigan. In comparison, MDCH reported 316 deaths in Detroit and 988 deaths per 100,000 residents in Wayne County related to heart disease in 2010.  Washtenaw County was on the opposite end of the spectrum with a mortality rate related to heart disease recorded at 138.2 per 100,000 residents.

Slide09


Of the three types of diseases presented, Alzheimer’s disease had the lowest mortality rates. According to MDCH, the state average was 22.7 Alzheimer’s related deaths per 100,000 residents from 2006-10. None of the areas presented on the map were at or above the state average. Macomb County had the highest rate at 20.9 while Detroit had the lowest at 10 deaths per 100,000 residents.

Information for Livingston and Washtenaw counties was not available because the state reported it had not collected enough data to determine an accurate rate.

Population, loss of state income play role in distribution of revenue sharing funding

October 21, 2013

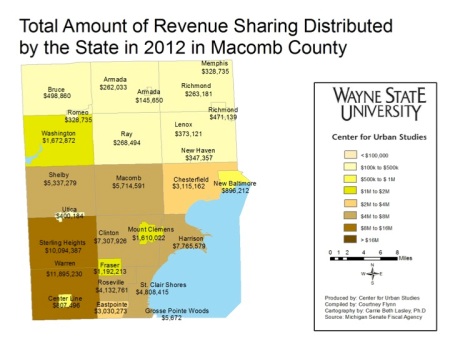
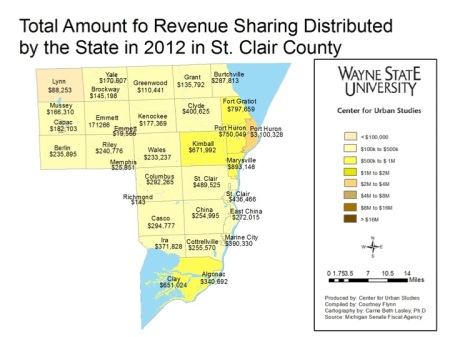
In the last post we examined how revenue sharing in Southeast Michigan has declined since 2003. In this post, the maps of each county show how much total revenue sharing each community in the seven-county region of Southeast Michigan received in 2012. Note that communities with higher populations , such as Detroit, received more funding.

Slide03 Slide04 Slide05 Slide06 Slide07 Slide08 Slide09

The above maps show the total revenue sharing funds that municipalities in the seven-county region received in 2012. Detroit received the highest amount of funds at $175,532,461, according the Senate Fiscal Agency. Of all the municipalities in the region, Detroit also had the largest population; in 2013, it was estimated by the Southeast Council of Governments (SEMCOG) to have 681,090 residents.

There are 12 municipalities in the region that received less than a $100,000 in revenue sharing for 2012. Southfield Township in Oakland County received the lowest level of funding; it also had a population of 14,547, according to 2012 data from Munetrix; SEMCOG does not list Southfield Township. Estral Beach, a village in Monroe County, had the lowest population of all the municipalities in the region in 2012; according to SEMCOG it was 388.

As can be seen in the maps above, the counties with higher populations (Wayne, Oakland, and Macomb) received higher revenue sharing funding. This is because funding formulas are, in part, related to population.

According to the Michigan Department of Treasury, statutory /EVIP funds are  distributed based on a formula. An upcoming post with provide examples of how these formulas have worked at different points in time. For now, it will  help to know that the formula considers the following:

•Population Unit Type
•Taxable Value Per Capita
•Yield Equalization
•Percent Share of Fiscal Year ’98

Population Unit Type – According to the Citizen’s Research Council (CRC), with the population unit type formula, cities are weighted the most and villages are weighted the least; to see how population and municipality type affect funding click here.

Taxable Value per Capita – The taxable value per capita formula takes the state’s average per capita taxable value and multiplies it by a given municipality’s population, according the Michigan Department of Treasury.

Yield Equalization – The yield equalization formula is used to “create a minimum guarantee on combined state and local revenue per mill of tax levy,” according to theCRC. This number is calculated by multiplying the number of mills in a local effort by the difference between the guaranteed and actual tax levy per capita; that number is then multiplied by the population in each municipality, according to the CRC.

Percent Share of Fiscal Year ’98 – According to the Michigan Department of Treasury, the percent share of fiscal year (FY) ’98 formula takes “each City, Village and Township’s FY ’98 statutory payments (Relative Tax Effort, Per Capita, and Inventory Reimbursement) and divides it by the FY ’98 Statewide Total Distributed to determine their Percent Share Factor.”

Beginning in 2002, 60 percent of the FY ’98 were paid using this formula; the percent paid then increased by 10 percent each year, according to the Michigan Department of Treasury.

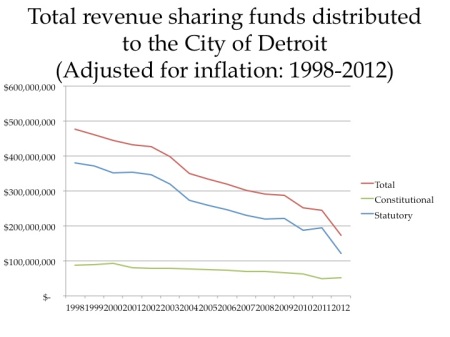
Slide11 Slide12

As we have seen in the last two posts, the amount of total revenue sharing funds distributed to municipalities across the Southeastern Michigan region has been decreasing, and Detroit is no exception. When looking at real dollars, the City of Detroit lost about $149.5 million in revenue sharing funding from 1998-2012; statutory funding represented about $148 million of that. Adjusting the number to account for inflation, using 1998 dollars as a base, Detroit lost about $304 million in total revenue sharing funding from 1998-2012, of which statutory funding represented approximately $255 million.

Up until 1998, the Relative Tax Effort (RTE), which was enacted in 1971, was intended to help monies follow communities’ needs, according to the CRC. However, there were complaints that cities fared better from the RTE than did townships and villages. This is why in 1998 an amendment was made to change how statutory funds were distributed. This amendment, which the formulas above reflect, shifted from distributing statutory funds based on intangibles, income, and small business taxes to providing 21.3% of sales tax revenues at the 4% tax rate, according to the CRC. Also, in 1998 then Gov. John Engler and Detroit Mayor Dennis Archer made a deal that the city would receive $333.9 million in annual revenue sharing funds if the city would decrease its city income tax rate, according to a Detroit Free Press Article and a Bridge Magazine report. Only a few years after the deal was made the state began to cut revenue sharing fund distributions, across the board. Since then Detroit has decreased its city income tax but has also not received the $333.9 million a year it was guaranteed.

In next week’s post we will provide examples of  how the statutory revenue sharing formula has changed from 2002-2012 and how it has been beneficial to one community and detrimental to another.

Highest Arab, Hispanic populations found in Wayne County

September 30, 2013

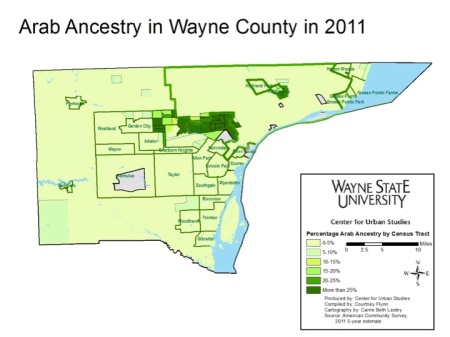
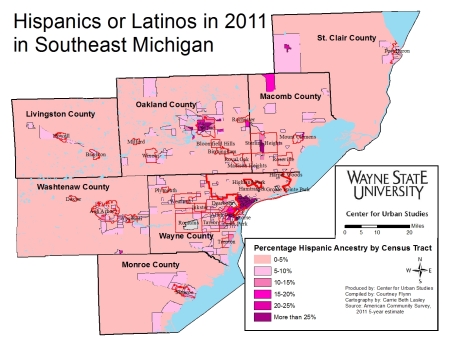
For this post another look at the population makeup of Southeastern Michigan is examined, this time by ethnicity. The maps below show that majority of the ethnic groups examined in this post-Arab and Hispanics or Latinos-were located in Wayne County, particularly in and around Detroit, as of 2011. It is important to note, however, that there was a presence of these ethnic groups throughout the seven-county region too. The only other areas with a high a percentage of these ethnic groups beyond the Detroit-Dearborn area was Pontiac in Oakland County and Sterling Heights in Macomb County.

The information shown throughout this post was obtained from the 2011 American Community Survey, based on five year estimates.

Slide03 Slide04 Slide05 Slide06 Slide07

Slide08

The Arab population in the seven county region was heavily concentrated in Dearborn in 2011, which is in Wayne County. According to the American Community Survey, about 40 percent of the Dearborn population was of Arab ancestry; in Wayne County 4.2 percent of the population are of Arab ancestry. When taking a closer look at the Dearborn population, it can be seen that those with a Lebanese ancestry made up a large portion of the population in northeast Dearborn, as did those with an unclassified ancestry and an “other” Arab ancestry. There was also a smaller presence of Syrians and Armenians throughout the area.

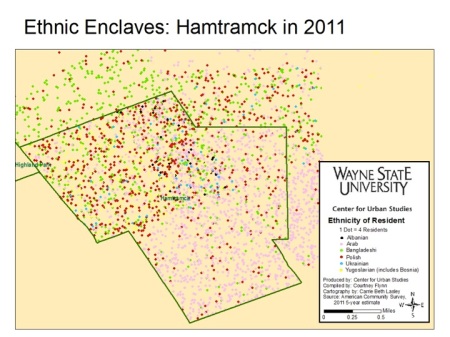
A similar concentration of Arabs could also be found in Hamtramck in 2011. According to the Hamtramck Ethnic Enclaves map, the Arab population within the city is more concentrated in the eastern half. Other ethnic groups present in Hamtramck include those of Bangladeshi, Yugoslavian and Polish decent.
In Sterling Heights, those with a Chaldean, Iraqi and Lebanese decent made majority of the city’s Arab population. About 43 percent of the city’s population is foreign born.

While the above mentioned cities had relatively high concentrations of Arabs as of 2011, there was also a smaller concentration of Arabs (5-20 percent) around Sterling Heights, the Farmington Hills-West Bloomfield areas in Oakland County, and the Wayne and Washtenaw County borders

SEMichHispanic2011-1

Slide11

Slide12

Slide13

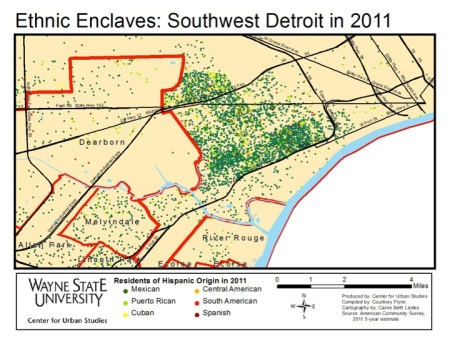
For the Hispanic-Latino ethnic group, Southwest Detroit had the heaviest concentration, where this group represented about 47 percent. A closer look at the Hispanic population in Southwest Detroit shows that majority of the Hispanic residents were of Mexican decent, as of 2011; those of Spanish decent were the least represented.

In Pontiac, there were areas where over 25 percent of the population is of a Hispanic or Latino background.

People of Hispanic or Latino decent were widely distributed across the region. Outside of Detroit, a few Downriver communities and portions of Pontiac, Hispanic or Latino residents appeared to represent between 0 and 10 percent of an area’s population.

Minorities increasingly distributed across the region

September 23, 2013

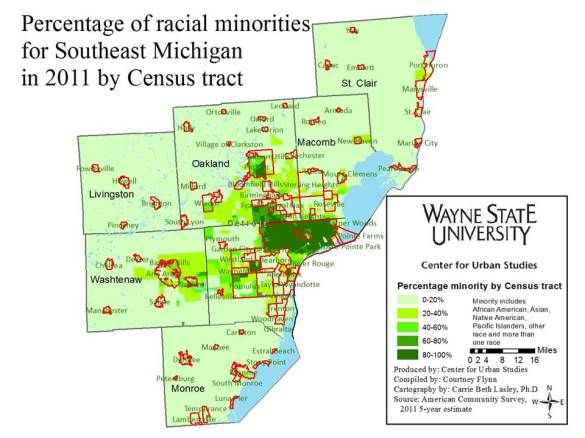
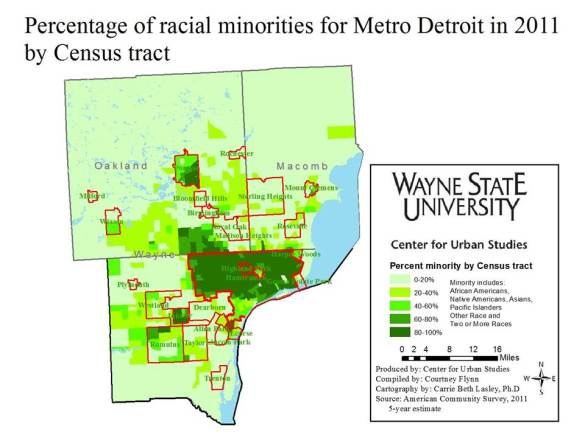
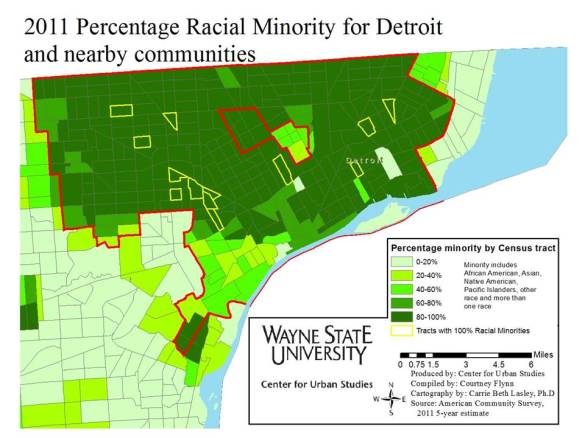
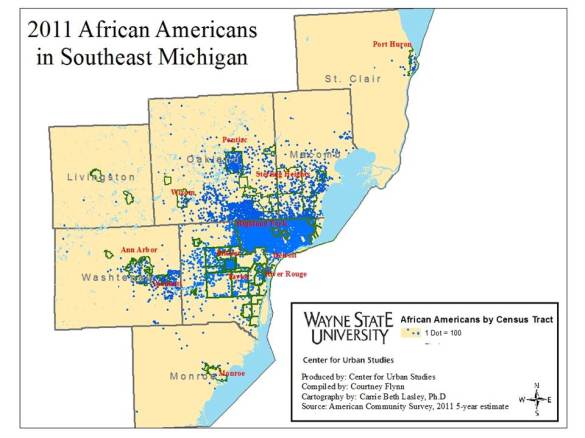
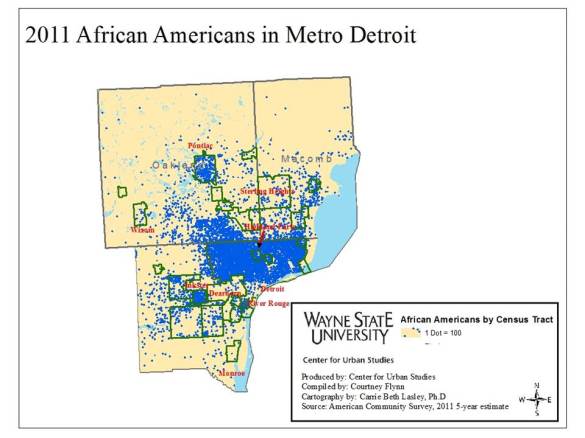
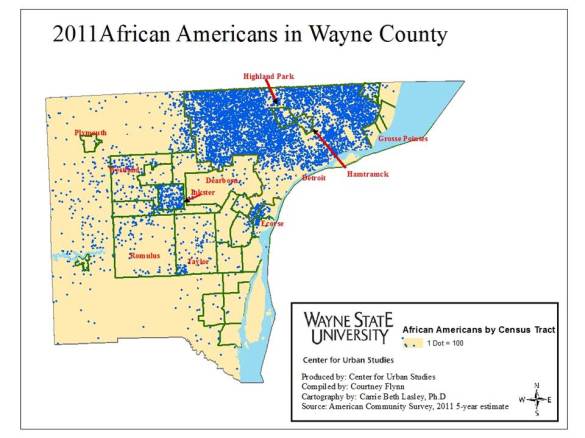
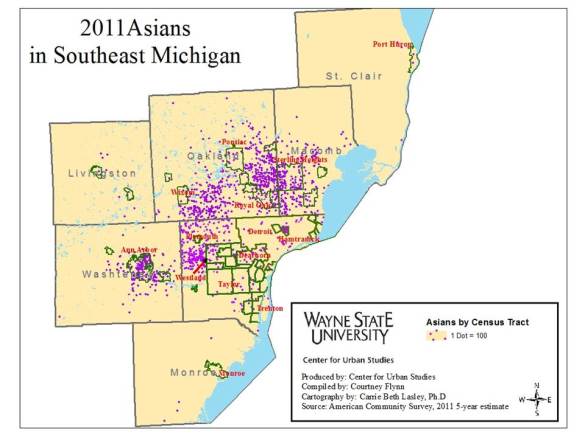
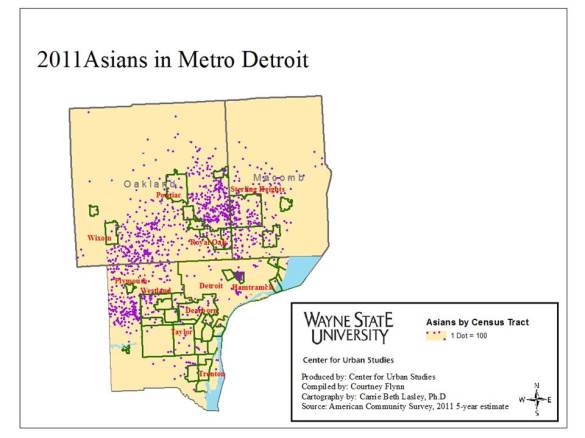
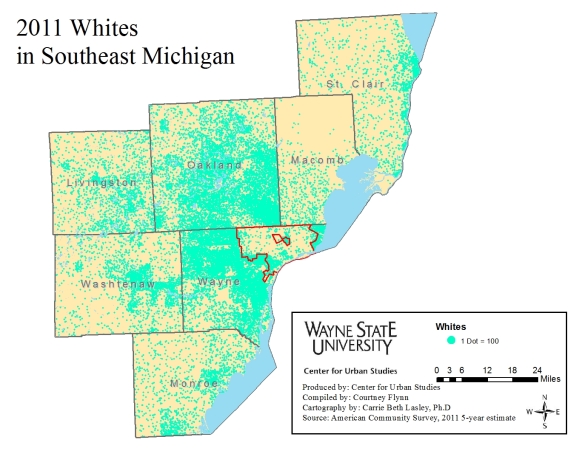
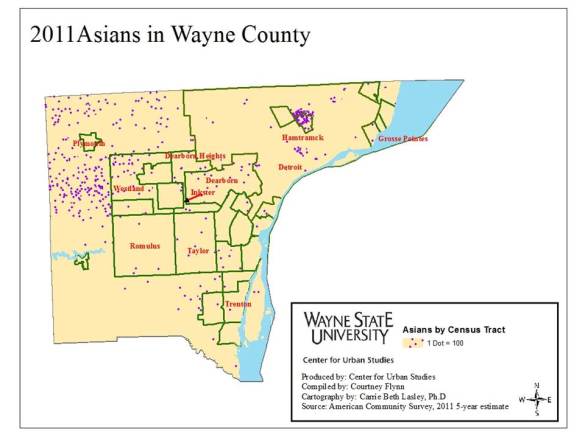
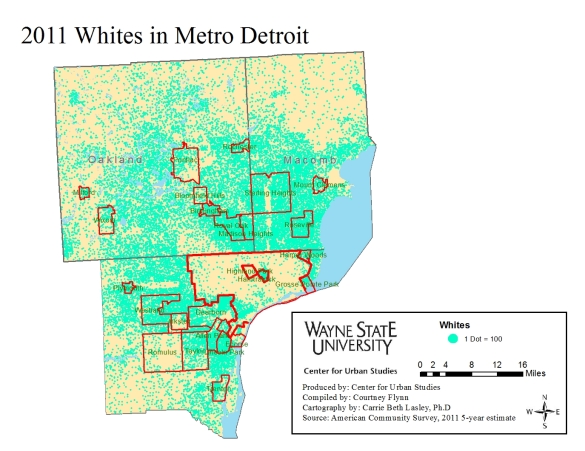
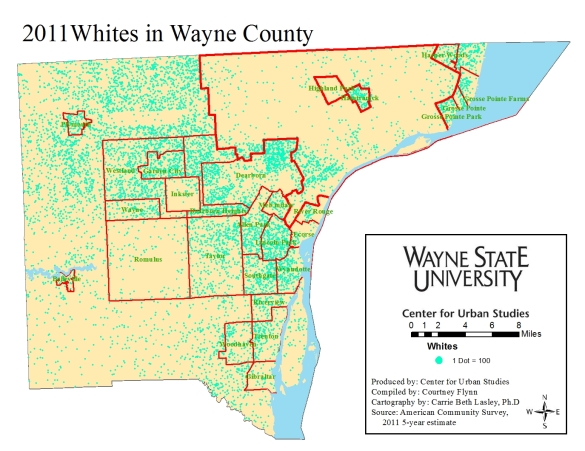
In the following post the percent of minorities that makeup Southeastern Michigan is examined. We examine the overall percent of minorities for the region, in addition to showing, through a dot map, the concentration of African Americans, Asians, and Whites in the region. The maps show that the City of Detroit has the highest percent of minorities in the region, particularly African Americans. However, Asians are largely located outside Detroit, though they represent a smaller portion of minorities.

The information shown throughout this post was obtained from the 2011 American Community Survey, which was based on five year estimates. For the total minority maps the following races are included: African American, Native American, Asian, Pacific Islander, other races and two more races. 

race1

race2

race3

race4

race5

race6

race7

race8WhitesSEMIch2011

race9WhitesMetro2011

WhitesWayne2011


The City of Detroit is predominantly minority, the majority of which are African American, according to the 2011 American Community Survey. While not every neighborhood of Detroit was predominantly minority, there were several-Northwest, Barton-McFarland and portions of the east, west and northeast sides-where 100 percent of the residents were identified as minority. Other areas in the region where the population was made up of between 81 and 100 percent minorities were Pontiac, Inkster, Highland Park and River Rouge.

When looking beyond the City of Detroit, the percent is much lower. For example, nearly all of Livingston, St. Clair, Monroe and Macomb counties are made up of 0-20 percent minorities. When looking at the dot map depicting where Asians live, it is clear that there are heavy concentrations in the Ann Arbor, Plymouth, Westland, Sterling Heights and Royal Oak. The dot maps that depict the White population show high concentrations just outside of the City of Detroit, in the Grosse Pointes, Lincoln Park and throughout Oakland County.

In next week’s post we will examine the distribution and concentration of various ethnic groups in the region, particularly Hispanics and Arabs.

Outlying counties in Southeast Michigan have lower population density

September 9, 2013

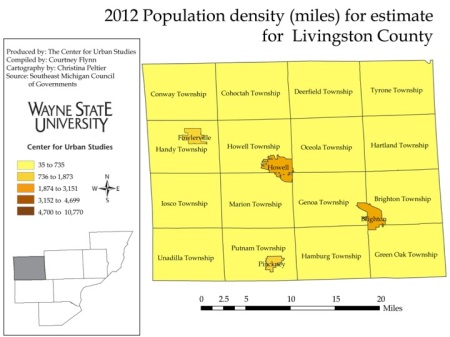
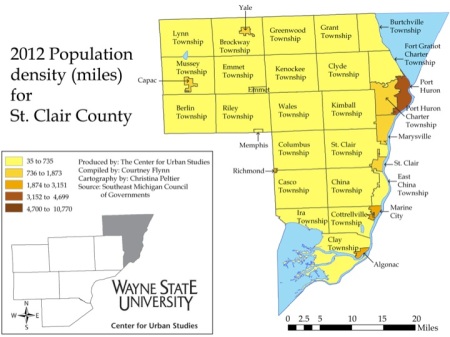
In a previous post, we examined the population densities in Wayne, Oakland, and Macomb counties. This post examines the population densities for the outlying counties in Southeast Michigan: Livingston, Monroe, St. Clair and Washtenaw.

As can be seen in the map below, the population densities in four outlying counties are much lower than those in Wayne, Macomb and Oakland counties.

The data used for these maps came from the Southeast Michigan Council of Governments (SEMCOG) December 2012 population estimates, which are the most recent available.  To calculate the population density, each municipality’s  population was divided by  its square mileage.

Slide3


Slide4


Slide5


Slide6


Slide7


There are no municipalities in the outlying counties in Southeast with a population density categorized in the highest bracket (4,700 to 10,770 residents per square mile) and only three municipalities  in the second highest bracket (3,152 to 4,699 residents per square mile): Port Huron in St. Clair County and Ann Arbor and Ypsilanti in Washtenaw County. Ypsilanti has the highest population density of all the communities presented in this post with 4,296 residents per square mile. In contrast, neither Livingston nor Monroe have any municipalities  with a population density above 3,151 residents per square mile(the maximum density for the middle bracket).


Detroit and surrounding communities have highest population density

September 2, 2013

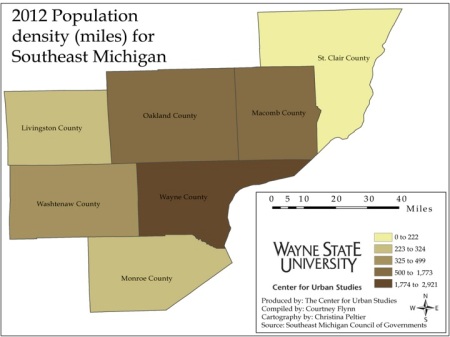
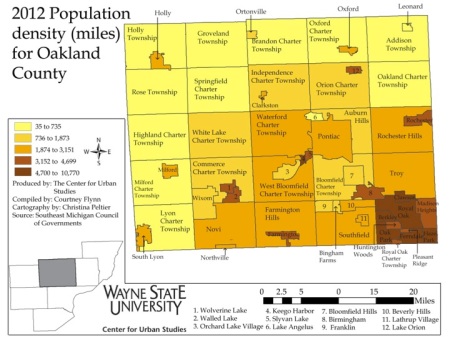
In this post we will examine the population density for the Southeast Michigan region as a whole, as well as the population density of each municipality within each county in the region. The first map shows the population density of the entire region by county, is presented in a different color because the data represents a larger region.

Population density is described as a measurement of population per area or unit volume; for this post population density is examined per square mile.

Overall, according to the maps below, Wayne County, as a whole, has the highest population density of the counties being examined. It can also be seen that the City of Detroit and the surrounding communities  have the highest population density; not all the surrounding communities are in Wayne County.

The data used for these maps came from the Southeast Michigan Council of Governments (SEMCOG) December 2012 population estimates. We use the SEMCOG estimates for 2012 because they are the most recent available.  That data was then divided by each municipality’s square mileage to determine the population density per square mile.

Slide3

Slide4


Slide5


Slide6


Of the three counties represented above, Oakland County has the highest number of municipalities with a population density ranging from 4,700 to 10,770 (this is the highest category, displayed in dark brown), although all of these are relatively small. These municipalities are: Berkeley (5,840), Clawson (5,840), Ferndale (5,073), Hazel Park (5,882), Keego Harbor (7,657), Oak Park (5,618) and Royal Oak (4,976). Ferndale, Oak Park and Hazel Park, all directly border Detroit, which is the largest municipality in the seven county region. However, even though Detroit is the largest municipality in the region, it does not have the highest population density; the population density for Detroit is 4,792. This still puts the city in the largest population density category, but Lincoln Park, which borders Detroit, has the highest population density in the county, it has been recorded at 6,513. The population density for Dearborn Heights, which also borders Detroit and is in the highest category, is recorded at 4,929; Wyandotte has a population density of 3,632. In Macomb County, with the exception of Center Line and Roseville, the municipalities with the highest population density also border Detroit. These municipalities are St. Clair Shores (4,186) and Eastpointe, (6,406). The population density for Roseville has been recorded at 4,793 and for Center Line it is recorded at 4,913.


In next week’s post we will examine the population density for the remainder of the Southeast Michigan region. The post will focus on Livingston, Monroe, St. Clair and Washtenaw counties. All of these counties have much lower population density levels than the three counties we examined this week.